
9. TEACHING WITH VISUAL SYMBOLS
- Oct 10, 2016
- 1 min read
TYPES OF A DIAGRAM
AFFINITY DIAGRAM - used to cluster comples apparently unrelated data into natural and meaningful groups.
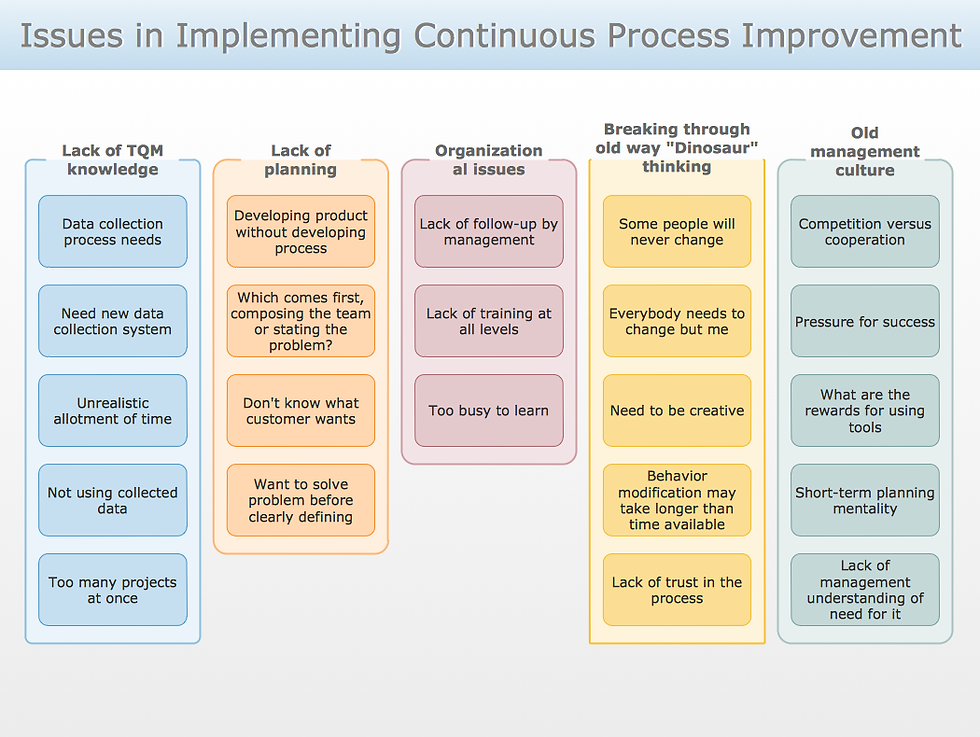
Reference: https://www.cheatography.com/uploads/davidpol_1438928341_Affinity-Diagram-Implementing-Continuous-Process-Improvement.png
TREE DIAGRAM : used to chart out, in increasing detail, the various tasks that must be accomplished to complete a project or achieve a specific objective.
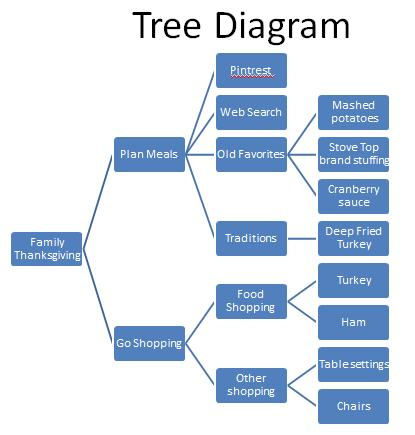
Reference: http://www.scrummastercertification.org/wp-content/uploads/2014/04/tree-diagram.jpg
FISHBONE DIAGRAM - It is also called cause and effect diagram. It is a structured form of brainstorming that graphically shows the relationship of possible causes and subcauses directly related to an identified effect/problem. It is most commonlly used to analyze work-related problems.

Reference: http://www.timvandevall.com/wp-content/uploads/2013/11/Blank-Fishbone-Diagram.jpg
B. CHARTS
A chart is a diagrammatic representation of relationships among individuals within an organization.
ORGANIZATIONAL CHART - shows how one part of the organization relates to other parts of the organization.
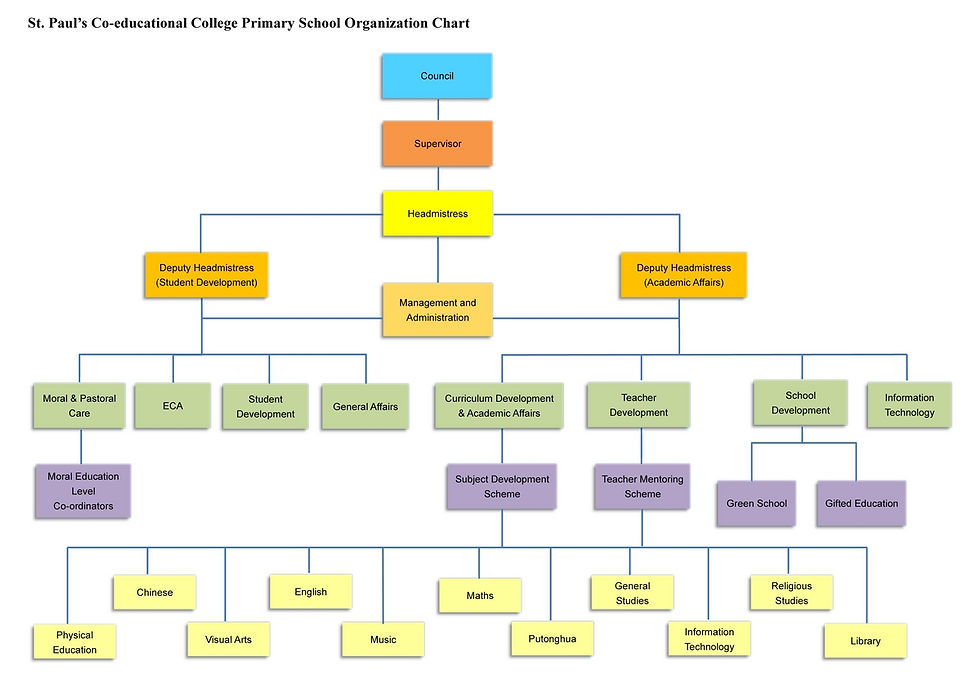
Reference: http://www.spccps.edu.hk/files/about/org/2015-16_Organization_chart_ENG.jpg
COMPARISON AND CONTRAST CHART
used to show similarities and differences betwwen two things.

Reference: http://englishusb112.pbworks.com/f/1302968527/compare-and-contrast-text-structure-graphic-organizer1.jpg
PARETO CHART - is a type of bar chart, prioritized in descending order of magnitude or importance from left to right.

Reference : https://upload.wikimedia.org/wikipedia/commons/8/8a/Pareto.PNG
Gannt Chart - is an activity time chart.

Reference: http://www.advsofteng.com/doc/cdnetdoc/images/gantt.png
C. GRAPHS
There are several types of graphs.
Pie or circle graph - recommended for showing parts of whole.

Reference : https://www.mathsisfun.com/data/images/pie-chart-movies.gif
Bar graph-
used in comparing the magnitude of similar items at different ties or seeing relative sizes of the parts of a whole.

Reference: http://illuminations.nctm.org/uploadedImages/Content/Lessons/Images/preK-2/334-SampleBarGraph.jpg
Pictorial graph - makes use of picture symbols.

Reference https://conceptdraw.com/a2076c3/p23/preview/640/pict--child-picture-graphs---vector-stencils-library.png--diagram-flowchart-example.png
Graphic organizers - You met several graphic organizers in your subject, Principles of teaching. Here is another graphic organizer, an information organizer.
Reference: http://creately.com/images/landing-new/k12/k12-1-large.jpg
Reference for texts:
Educational Technology 1
Second Edition
Copyrigh 2012 by
Brenda B. Corpuz,Ph.D.
Paz I. Lucido, Ph.D.
and
Lorimar Publishing, INC.


Comments